
Learn to read liquidity on a price chart
A beginner video mini-course on how liquidity forms, where stop orders tend to cluster, and how price behaves around those areas. Includes a chart indicator that marks liquidity zones for study.

Diwali offer ends in
Offer ends on 8 November 2026, 11:59 PM IST. After that, the price returns to ₹2,999.
The Diwali offer has ended. The current price is shown above.
- Lifetime access to the course
- Delivered by email after purchase
- Made for beginners
Educational content only. This is not investment advice. Trading involves risk and results are not guaranteed. All sales are final.
Questions beginners often have about price movement
Popular indicators such as RSI, MACD and moving averages are calculated from past prices. Liquidity analysis is a different framework. It looks at areas where many orders, including stop-losses, tend to sit, and studies how price behaves around them.
This course explains that framework step by step. It is one way of reading charts among many, and it does not predict the market.
- Why does price sometimes push through an obvious level and then reverse?
- What are buy-side and sell-side liquidity?
- How are stop orders connected to liquidity?
- How can a breakout be told apart from a liquidity sweep?
- How do order blocks and liquidity zones fit together in chart analysis?
What a liquidity sweep can look like
A simple illustration of the idea covered in lesson three.
- Liquidity zone. Stop orders tend to sit just above equal highs.
- Sweep. Price briefly trades through the zone, then closes back below it.
- What followed here. Price moved lower. This is one possible outcome, not a rule.
What is included
One short video course and one chart indicator, delivered to your email after purchase.
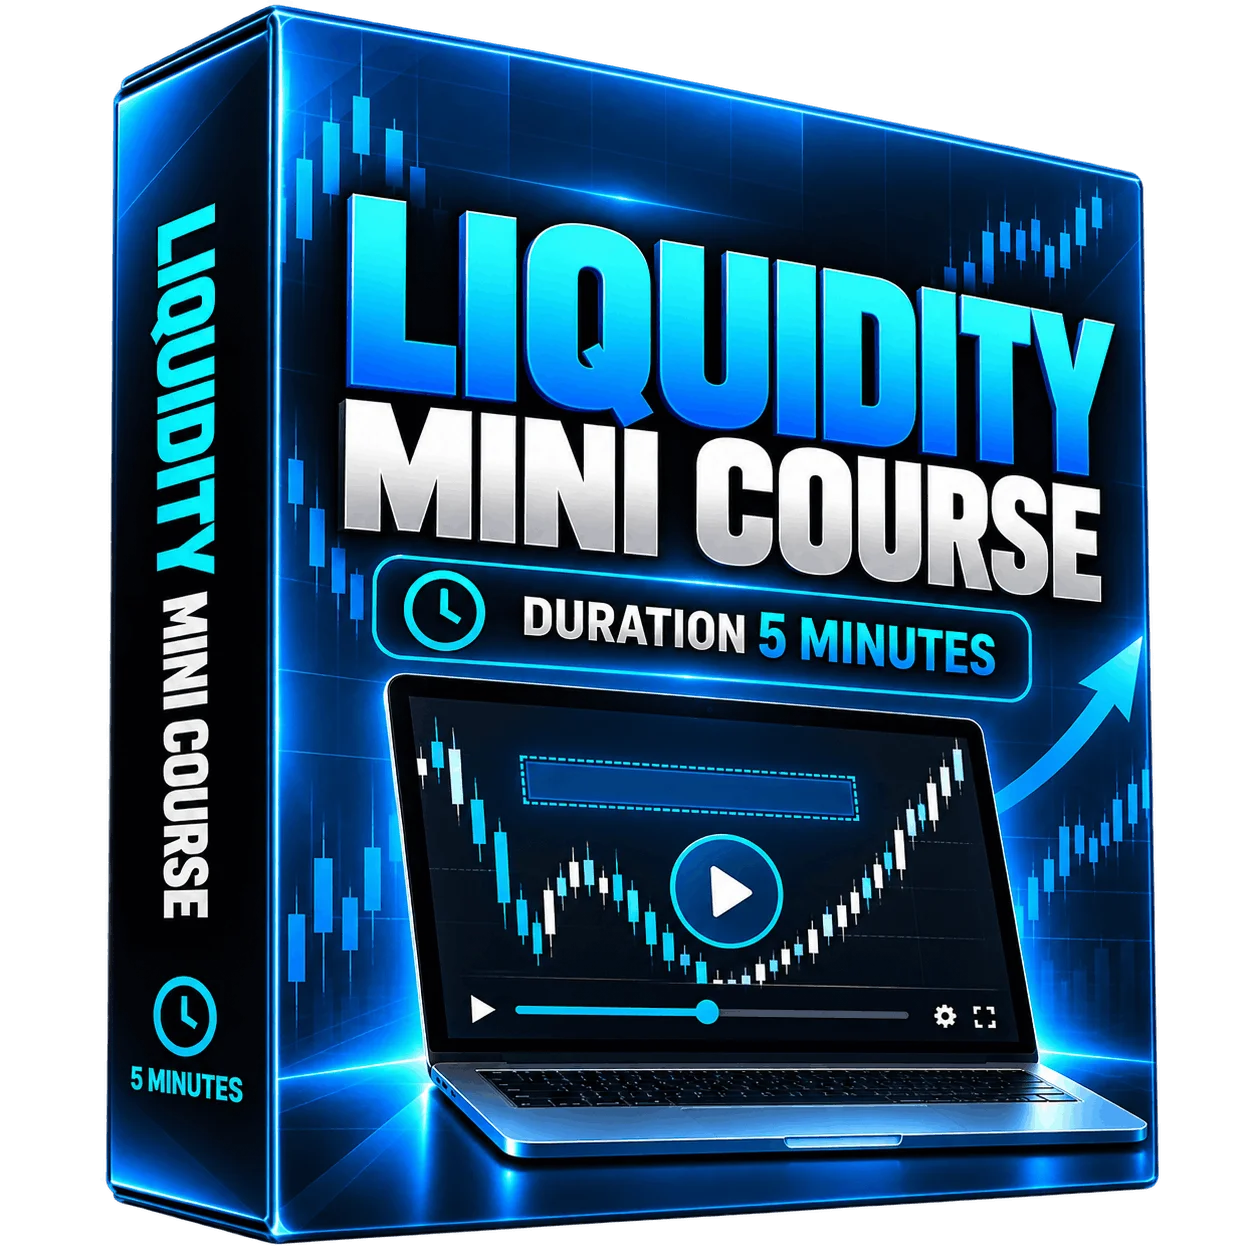
Liquidity Spotting Fundamentals
Video mini-course for beginners
- What liquidity is and how it appears on a chart
- Buy-side and sell-side liquidity explained
- How liquidity sweeps look on a chart, and how to read them with market structure
- Combining order blocks with liquidity zones in your analysis
- Chart walkthroughs using past examples
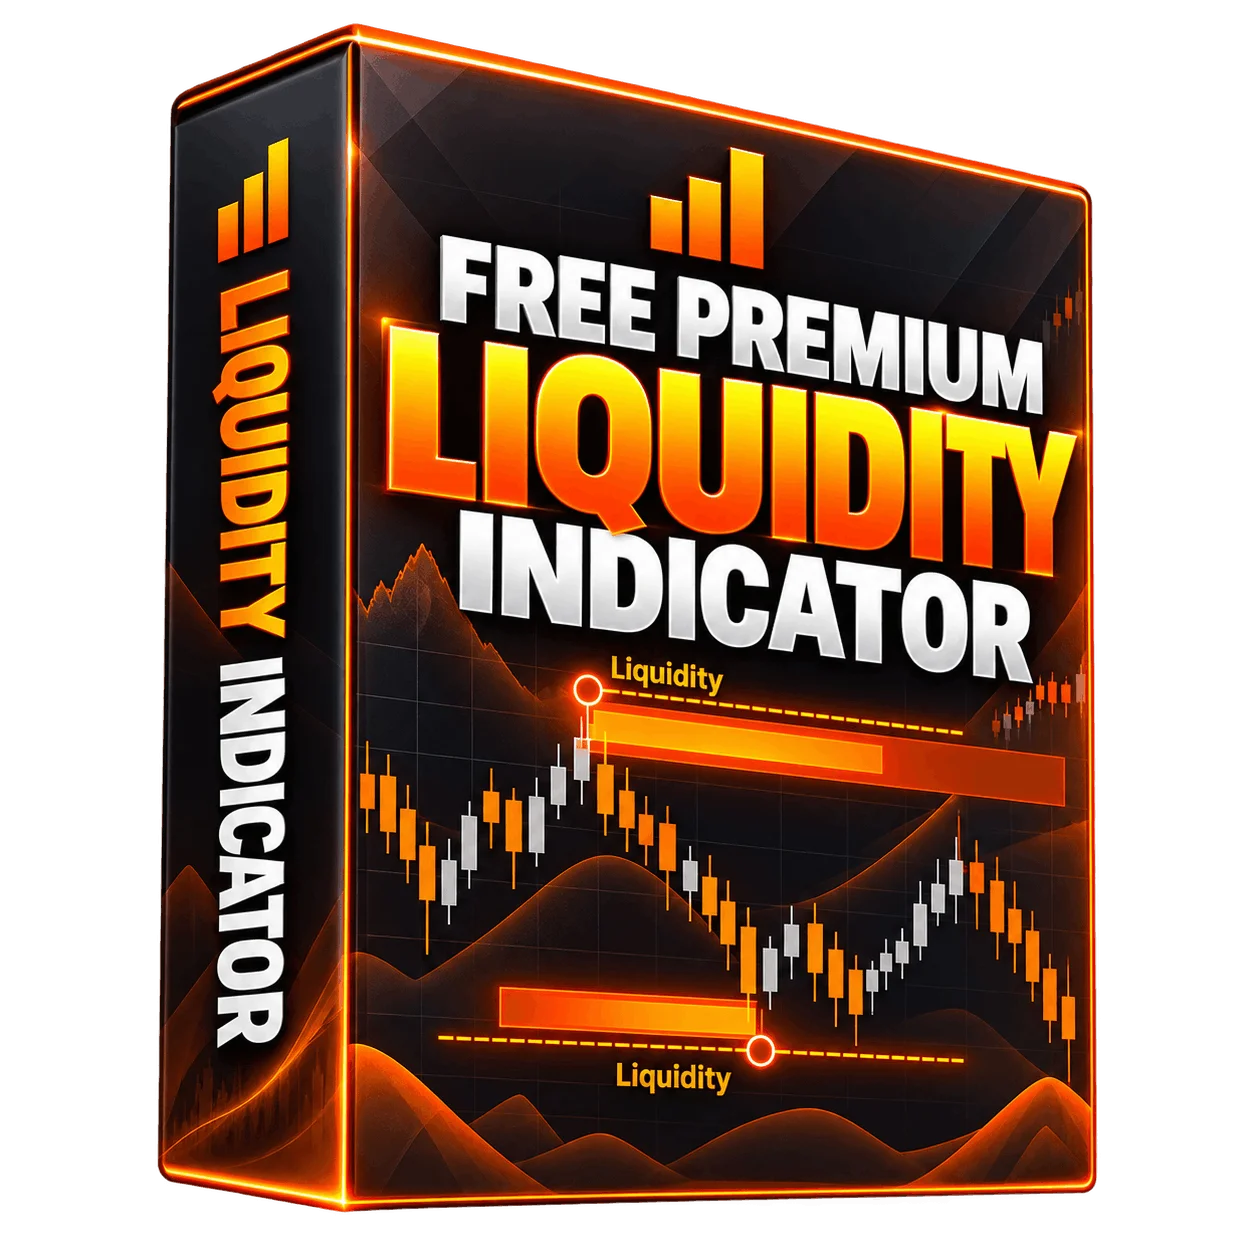
Premium Liquidity Indicator
- Marks liquidity zones on your chart automatically
- Setup guide for your charting platform
- Lifetime access with no recurring fee
The indicator is a chart-study aid. It does not give buy or sell signals and does not guarantee any result.
Educational content only. All sales are final.
Student feedback
A student shares their experience of learning with the course.
Individual experiences vary. This feedback reflects one student's opinion about learning, not a promise of results.
What students say about the course
Reviews from students about their learning experience. Individual experiences vary and are not a promise of results.
Paste a real student review here.
Paste a real student review here.
Paste a real student review here.
Paste a real student review here.
Paste a real student review here.
Paste a real student review here.
Paste a real student review here.
Paste a real student review here.
How it works
Complete checkout
Pay ₹299 once through our secure checkout.
Check your email
Access details for the course and the indicator are sent to the email you enter at checkout.
Start learning
Watch the lessons and follow the setup guide to add the indicator to your charts.
Frequently asked questions
Who is this course for?
Will this make me profitable?
How do I receive the course and the indicator?
Does the indicator give buy or sell signals?
Which charting platform does the indicator work on?
Is there a refund?
What if I need help?
Have a question before you buy?Our team replies on Telegram. You can also email us.
Chat on TelegramGet the course and the indicator
Learn the concepts at your own pace, then study them on your own charts.
- Liquidity Spotting Fundamentals video mini-course
- Premium Liquidity Indicator with setup guide
- Lifetime access with no recurring fee
- Delivered to your email after purchase
Offer ends in
Offer ends on 8 November 2026, 11:59 PM IST. After that, the price returns to ₹2,999.
The Diwali offer has ended. The current price is shown above.
No subscription. All sales are final, so please read our Refund Policy before you buy.